Debugging Capacitor iOS Apps
Because hybrid apps built with Capacitor are simply web apps running in a WebView, we can debug them using the same tools most web developers are already familiar with. This post will go over how to use the Web Inspector in Safari to debug a Capacitor powered iOS app (same can apply to apps built with Cordova).
If an app is utilizing a plugin or some native feature of the device, then this type of debugging will not be helpful. For app functionality built with native components, the debugger in a Native IDE will be needed.
Enable Web Inspector
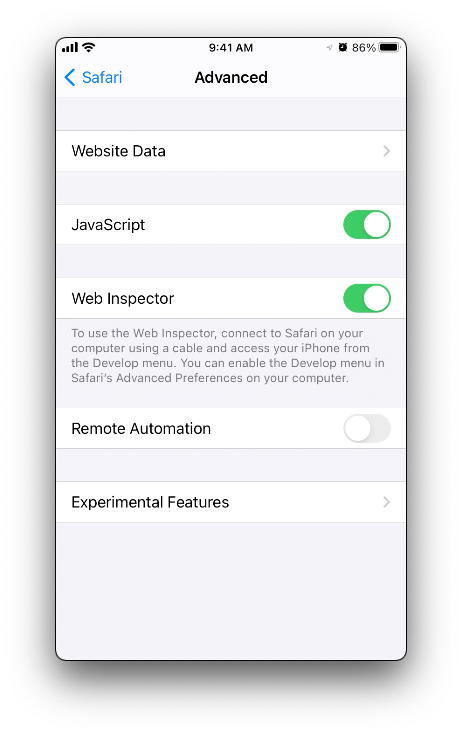
First we need to turn on Web Inspector on the device (on the simulator this step isn’t needed). Open Settings > Safari, then tap “Web Inspector”.
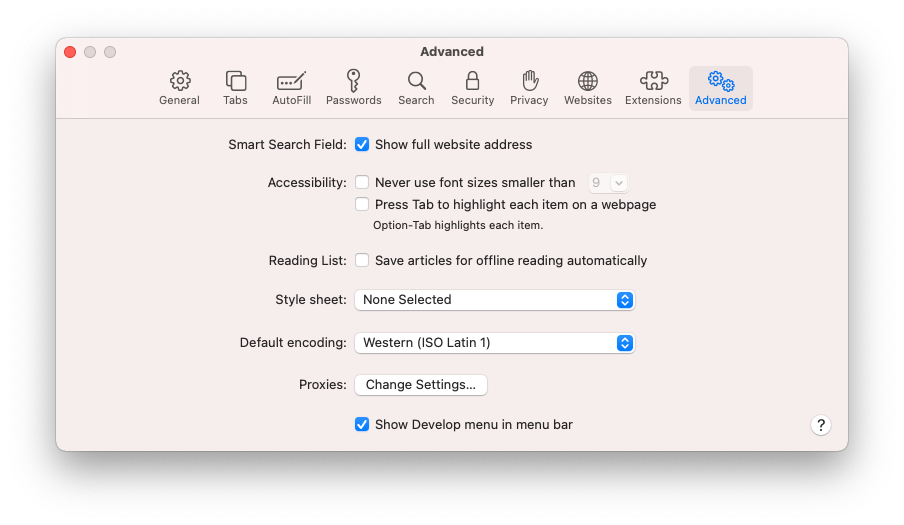
Turn on Develop tab in Safari if not already enabled. In the menubar click Safari > Preferences. Then click the advanced tab and check “Show Develop menu”.
Inspect Device
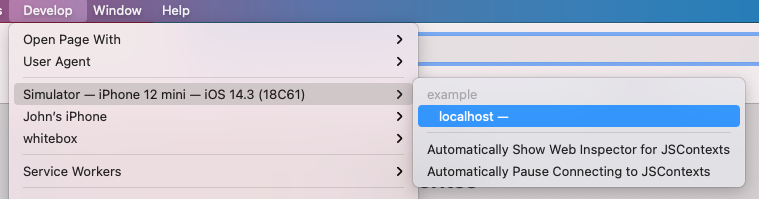
With the app open on the device, open Safari and click on the Develop tab in the menu. Select the device to debug from the list and Web Inspector will open.
Reloading the WebView
Sometimes its useful to have the Web Inspector console open to capture logs or any startup activity from your app when it first launches. Since attaching Web Inspector occurs after the app has been open, reloading only the WebView context can be useful. Using window.location.reload()
in the console will reload the app’s web content.